
Random Forest Tuning
Over the past 2 years since learning Python/R from zero, I have been forcing myself to learn how to build an algorithmic trading program. It has definitely been a very steep curve but as with everything else, a challenege is what I enjoy. It definitely took a lot of reading on trading strategies but also improving my programming skills in general. I remember how much I forced myself to do countless variations “Hello World” just to learn print functions. Now, I share my knowledge as much as I can with other people who are interested, either programming in general, infosec or data science.
In this post, we will look at parameter tuning for random forest for mtry and trees. It will follow the standard grid search but deal with the “typical values” as compared to actual data. In this case, I am performing a regression modelling for stocks/shares in the Kuala Lumpur Stock Exchange (KLSE).
What do these parameters do?
What is mtry?
Mtry is the number of randomly chosen variables/features when forming a split in the tree. If the data has 60 different features/predictors, the model will select a subset of it during splitting and find the feature which reduces the node impurity the most or best explains the data (in simple terms, least error). This is in comparison to a standard recursive partitioning algorithm where it searches through all the features, instead of a subset, and finds the feature which best describes the data. Essentially is the amount of features made available during splitting.
What are trees?
These are typically the depth (vertical depth) of the decision trees which are built to describe the data based on the variables. It can also be thought of as the levels of splits.
Here is a more comprehensive explanation at Analytics Vidhya
Conventional wisdom
Typical advice you will hear when working with random forests is:
- build deep trees until the magnitude of improvement for error tapers down
- start with investigating the values around mtry = sqrt(features)
Before we continue, some details of R packages I am using:
- ranger - optimized (read as FAST!) random forest (parallelized over cpus)
- caret - postResample() to measure RMSE and Rsquared
Actual results
Generally, when we start tuning these parameters we essentially hold either one value constant and iterate over the other. In the figure below, that is exactly what I have done, set the number of trees at 150 and look at varying values for mtry where mtry = sqrt(features) = 8.
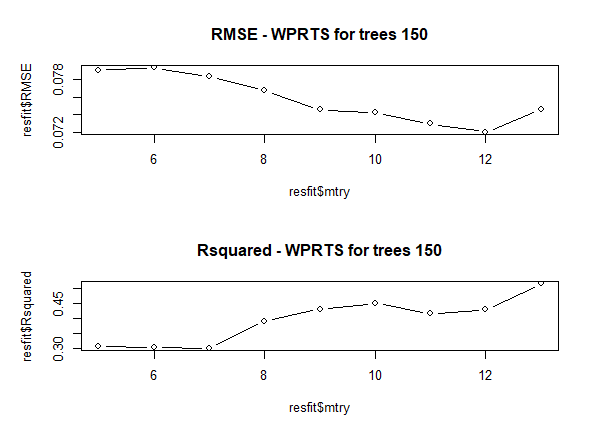
From the figure, it is obvious that mtry=12 is the best since it gives the lowest value for RMSE around 0.072. However, the overall Rsquared is very low around 0.45. If we were to stick with the “typical advice” then the solution would have been to choose mtry=12 and continue on. However, being curious as usual, I decided to iterate mtry at the higher extreme where having all the possible features available for consideration.
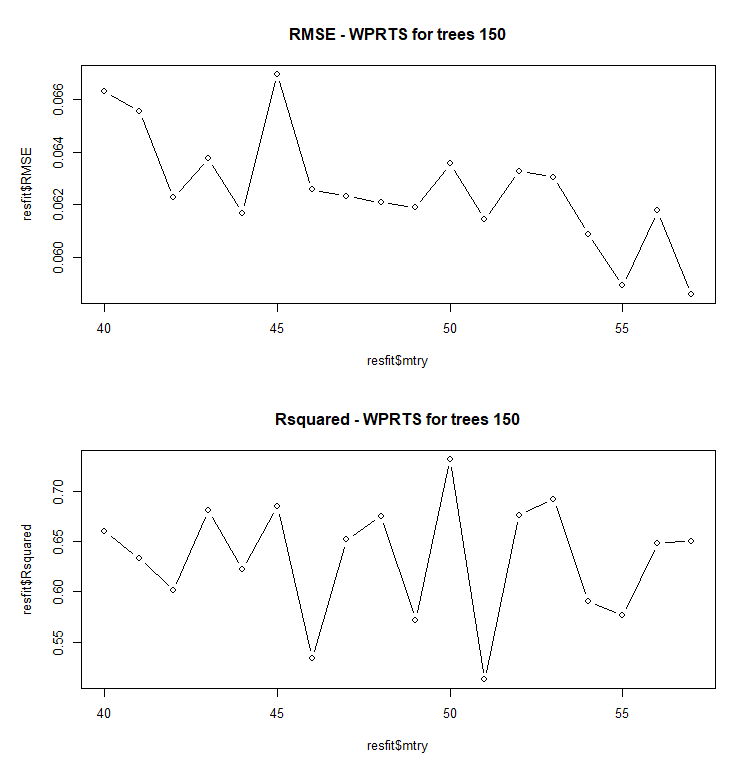
As is noticeable, even the range for RMSE has dropped to below 0.07 and the Rsquared has climbed to higher than 0.5. So it seems that having all, if not most, of the features considered at each split improves the model.
Given that I will be modelling for all the stocks on the KLSE main board, I will choose mtry between 50 and 57.
Next, we iterate over the trees at constant value of mtry to determine the best depth. Here, I tested values of mtry=20 and mtry=57
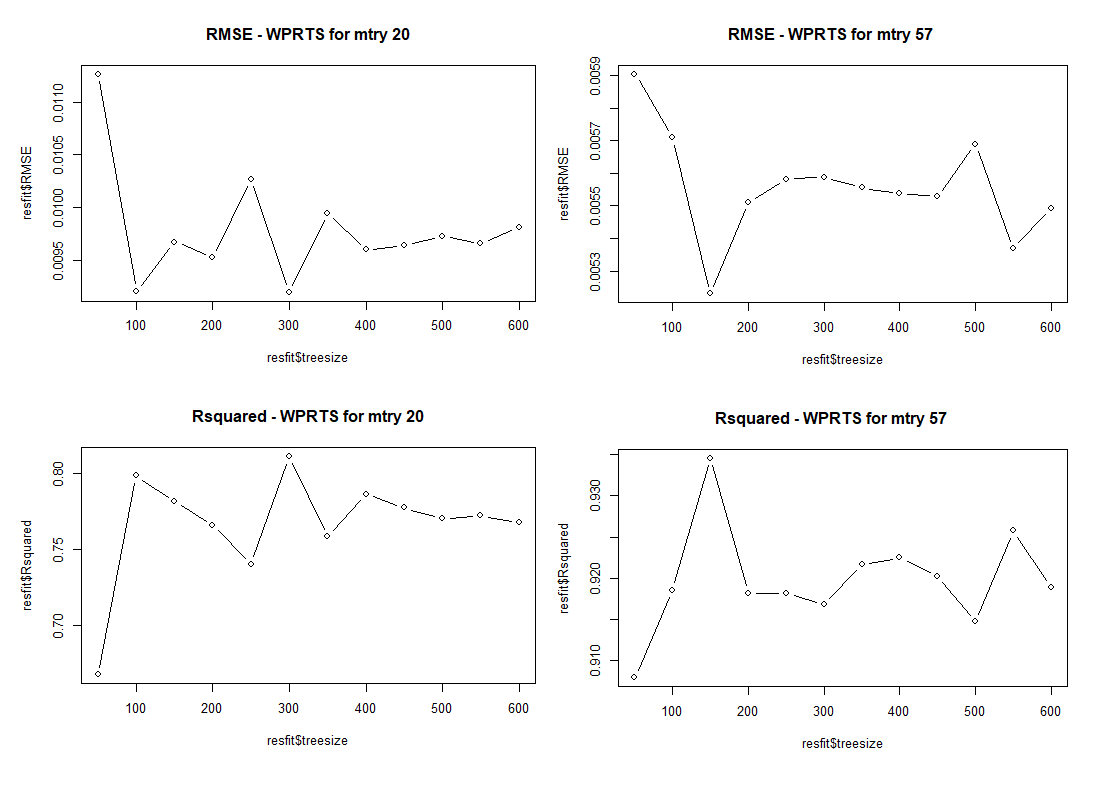
One of the first things to note is the difference in the ranges, RMSE and Rsquared drastically drops at mtry=57.
Furthermore we note that for:
- mtry=20, best results are at trees=100 or 300
- mtry=57, best results are at trees=150
At this point it is clear, that the best ranges are:
- mtry between 50-57
- trees between 100-150, possibly 200
If I were to choose the best solution, I would have implemented the modelling to perform a search over the two ranges and use the optimal model. However, I have to operate under certain constraints, namely, computation time given that I am working on an old Intel i5-750 and also the fact that I am modelling the entire main board ( approx. 200 stocks after filtering).
At this juncture, I have opted to iterate over mtry given that it provides the most significant impact and set trees=150.
What does this mean?
As with most problems in data science, you will have conventional wisdom (qualitative) and the results itself (quantitative), and sometimes both do not point in the same direction. It is likely that some problems that you work on will see these two diverge but what is important is to ask why this is the case and understand its implications for future data.
Why is this the case?
- Possibly that because this is a regression (continuous variable instead of classification), it is necessary that more information is required at each split to better describe the data.
What are the implications for future data?
- Given that this is the case for all of the stocks that I have been investigating over the past month, it is unlikely that it will vary below mtry=50. It is entirely possible that the optimal number of trees may move around but as we have seen, mtry has a bigger impact on the fit metric.
Possible improvements?
- Buy a better computer ( Ryzen Threadripper comes to mind) or rent high cpu servers such as AWS.
- I have been looking at possible use of GPUs for modelling but at this stage, it seems that there are several limitations and unless I were to write my own code, there are no packages that do this. Even if there were, it would be a very small number of models.